Class OA(24; 2; 26)
This page contains information about D-efficiency and GWLP values of the arrays. The results have been generated with the Orthogonal Array package. If you use these data, please cite the paper Complete Enumeration of Pure-Level and Mixed-Level Orthogonal Arrays.
Results
| Statistic | Results |
| Number of non-isomorphic arrays | 1350 |
| Best GWLP | 1.0000,0.0000,0.0000,0.0000,1.6667,0.0000,0.0000 1 array |
| D-efficiency | Best value: 0.7926 [8 arrays with highest D-efficiency value] |
| Average VIF | Best value 2.0376 [3 arrays with best average VIF value] |
| E-efficiency | Best value 0.1590 |
| Data | all arrays (binary) |
| Data (80 best VIF arrays) | 80 array(s) |
| Processing time | < 1 minute |
Scatter plot
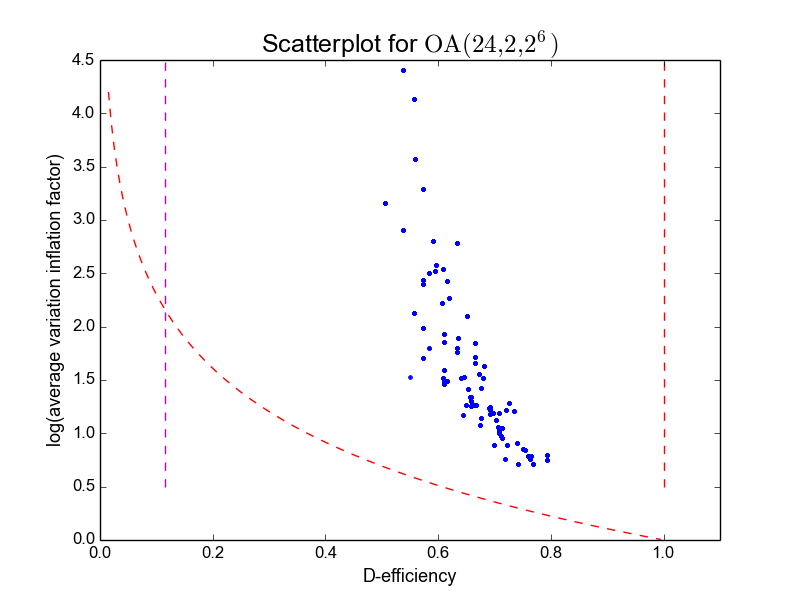
Table of arrays (selection)
| Array | Rank (2nd order) | D-efficiency | Average VIF | E-efficiency | GWLP |
|---|---|---|---|---|---|
| 1 | 22 | 0.79260 | 2.11818 | 0.05719 | 1.00,0.00,0.00,0.4444,0.5556,0.6667,0.00 |
| 55 | 22 | 0.79260 | 2.11818 | 0.05719 | 1.00,0.00,0.00,0.5556,0.4444,0.5556,0.1111 |
| 49 | 22 | 0.79260 | 2.11818 | 0.05719 | 1.00,0.00,0.00,0.6667,0.3333,0.6667,0.00 |
| 8 | 22 | 0.79260 | 2.20909 | 0.04808 | 1.00,0.00,0.00,0.4444,0.5556,0.6667,0.00 |
| 60 | 22 | 0.79260 | 2.11818 | 0.05719 | 1.00,0.00,0.00,0.6667,0.3333,0.2222,0.4444 |
| 71 | 22 | 0.79260 | 2.20909 | 0.04808 | 1.00,0.00,0.00,0.6667,0.3333,0.2222,0.4444 |
| 73 | 22 | 0.79260 | 2.20909 | 0.04808 | 1.00,0.00,0.00,0.5556,0.4444,0.5556,0.1111 |
| 74 | 22 | 0.79260 | 2.20909 | 0.04808 | 1.00,0.00,0.00,0.6667,0.3333,0.6667,0.00 |
| 288 | 22 | 0.76747 | 2.04188 | 0.08492 | 1.00,0.00,0.00,0.7778,0.4444,0.3333,0.1111 |
| 326 | 22 | 0.76747 | 2.04188 | 0.08492 | 1.00,0.00,0.00,0.6667,0.5556,0.4444,0.00 |
| Index | D-efficiency | Mean 3-proj D-eff | Mean 4-proj D-eff | Mean 5-proj D-eff |
|---|---|---|---|---|
| 1 | 0.7926 | 0.9902 | 0.9634 | 0.9115 |
| 55 | 0.7926 | 0.9877 | 0.9585 | 0.9068 |
| 49 | 0.7926 | 0.9852 | 0.9536 | 0.9029 |
| 8 | 0.7926 | 0.9902 | 0.9634 | 0.9106 |
| 60 | 0.7926 | 0.9852 | 0.9536 | 0.9007 |
| 71 | 0.7926 | 0.9852 | 0.9532 | 0.8988 |
| 73 | 0.7926 | 0.9877 | 0.9581 | 0.9049 |
| 74 | 0.7926 | 0.9852 | 0.9532 | 0.9009 |
| 288 | 0.7675 | 0.9828 | 0.9437 | 0.8778 |
| 326 | 0.7675 | 0.9852 | 0.9486 | 0.8825 |
Page generated on Fri Mar 11 00:19:53 2016.