Class OA(40; 2; 24)
This page contains information about D-efficiency and GWLP values of the arrays. The results have been generated with the Orthogonal Array package. If you use these data, please cite the paper Complete Enumeration of Pure-Level and Mixed-Level Orthogonal Arrays.
Results
| Statistic | Results |
| Number of non-isomorphic arrays | 32 |
| Best GWLP | 1.0000,0.0000,0.0000,0.0000,0.0400 1 array |
| D-efficiency | Best value: 0.9889 [2 arrays with highest D-efficiency value] |
| Average VIF | Best value 1.0227 [2 arrays with best average VIF value] |
| E-efficiency | Best value 0.8000 |
| Data | all arrays |
| Data (32 best VIF arrays) | 32 array(s) |
| Processing time | < 1 minute |
Scatter plot
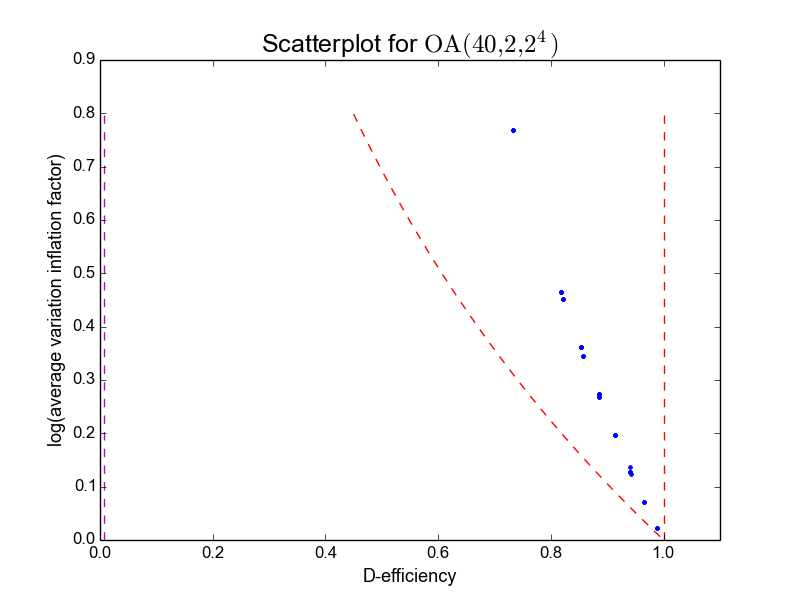
Table of arrays (selection)
| Array | Rank (2nd order) | D-efficiency | Average VIF | E-efficiency | GWLP |
|---|---|---|---|---|---|
| 2 | 11 | 0.98893 | 1.02273 | 0.80000 | 1.00,0.00,0.00,0.00,0.04 |
| 12 | 11 | 0.98893 | 1.02273 | 0.80000 | 1.00,0.00,0.00,0.04,0.00 |
| 9 | 11 | 0.96571 | 1.07458 | 0.60000 | 1.00,0.00,0.00,0.12,0.00 |
| 10 | 11 | 0.96571 | 1.07458 | 0.60000 | 1.00,0.00,0.00,0.08,0.04 |
| 4 | 11 | 0.94162 | 1.13258 | 0.60000 | 1.00,0.00,0.00,0.16,0.04 |
| 11 | 11 | 0.94096 | 1.13636 | 0.55279 | 1.00,0.00,0.00,0.04,0.16 |
| 22 | 11 | 0.94096 | 1.13636 | 0.55279 | 1.00,0.00,0.00,0.16,0.04 |
| 21 | 11 | 0.94096 | 1.13636 | 0.55279 | 1.00,0.00,0.00,0.20,0.00 |
| 8 | 11 | 0.93953 | 1.14610 | 0.40000 | 1.00,0.00,0.00,0.16,0.04 |
| 5 | 11 | 0.91373 | 1.21698 | 0.37480 | 1.00,0.00,0.00,0.12,0.16 |
| Index | D-efficiency | Mean 3-proj D-eff |
|---|---|---|
| 2 | 0.9889 | 1.0000 |
| 12 | 0.9889 | 0.9957 |
| 9 | 0.9657 | 0.9870 |
| 10 | 0.9657 | 0.9913 |
| 4 | 0.9416 | 0.9827 |
| 11 | 0.9410 | 0.9957 |
| 22 | 0.9410 | 0.9820 |
| 21 | 0.9410 | 0.9777 |
| 8 | 0.9395 | 0.9827 |
| 5 | 0.9137 | 0.9870 |
Page generated on Fri Mar 11 00:19:51 2016.