Class OA(44; 2; 24)
This page contains information about D-efficiency and GWLP values of the arrays. The results have been generated with the Orthogonal Array package. If you use these data, please cite the paper Complete Enumeration of Pure-Level and Mixed-Level Orthogonal Arrays.
Results
| Statistic | Results |
| Number of non-isomorphic arrays | 28 |
| Best GWLP | 1.0000,0.0000,0.0000,0.0331,0.0083 1 array |
| D-efficiency | Best value: 0.9886 [1 array with highest D-efficiency value] |
| Average VIF | Best value 1.0234 [1 array with best average VIF value] |
| E-efficiency | Best value 0.8182 |
| Data | all arrays |
| Data (28 best VIF arrays) | 28 array(s) |
| Processing time | < 1 minute |
Scatter plot
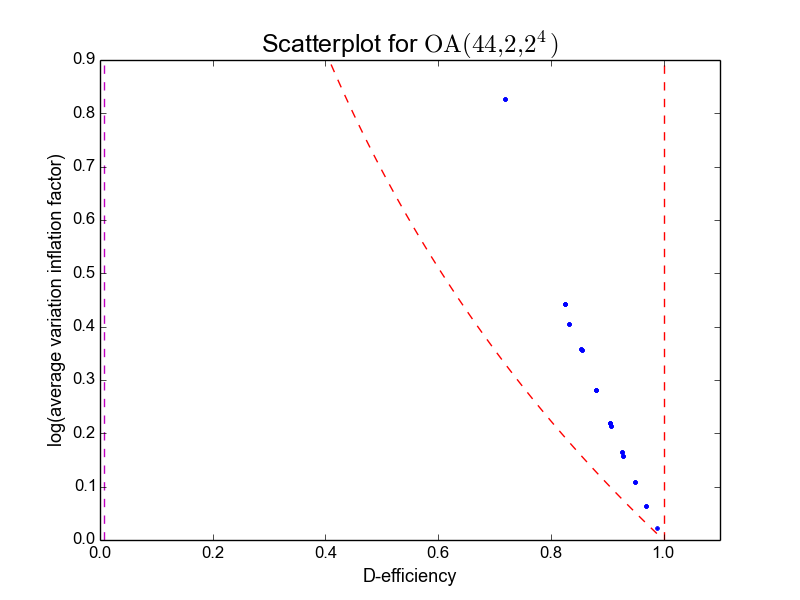
Table of arrays (selection)
| Array | Rank (2nd order) | D-efficiency | Average VIF | E-efficiency | GWLP |
|---|---|---|---|---|---|
| 3 | 11 | 0.98857 | 1.02345 | 0.81818 | 1.00,0.00,0.00,0.03306,0.008264 |
| 15 | 11 | 0.96941 | 1.06604 | 0.60252 | 1.00,0.00,0.00,0.09917,0.008264 |
| 4 | 11 | 0.96941 | 1.06604 | 0.60252 | 1.00,0.00,0.00,0.03306,0.07438 |
| 13 | 11 | 0.94942 | 1.11413 | 0.56618 | 1.00,0.00,0.00,0.09917,0.07438 |
| 11 | 11 | 0.94942 | 1.11413 | 0.56618 | 1.00,0.00,0.00,0.1653,0.008264 |
| 22 | 11 | 0.92805 | 1.17161 | 0.51161 | 1.00,0.00,0.00,0.2314,0.008264 |
| 1 | 11 | 0.92805 | 1.17161 | 0.51161 | 1.00,0.00,0.00,0.03306,0.2066 |
| 10 | 11 | 0.92696 | 1.17957 | 0.38781 | 1.00,0.00,0.00,0.2314,0.008264 |
| 12 | 11 | 0.92696 | 1.17957 | 0.38781 | 1.00,0.00,0.00,0.1653,0.07438 |
| 6 | 11 | 0.90590 | 1.23723 | 0.37587 | 1.00,0.00,0.00,0.2975,0.008264 |
| Index | D-efficiency | Mean 3-proj D-eff |
|---|---|---|
| 3 | 0.9886 | 0.9964 |
| 15 | 0.9694 | 0.9892 |
| 4 | 0.9694 | 0.9964 |
| 13 | 0.9494 | 0.9892 |
| 11 | 0.9494 | 0.9819 |
| 22 | 0.9281 | 0.9737 |
| 1 | 0.9281 | 0.9964 |
| 10 | 0.9270 | 0.9747 |
| 12 | 0.9270 | 0.9819 |
| 6 | 0.9059 | 0.9674 |
Page generated on Fri Mar 11 00:19:51 2016.