Class OA(48; 2; 24)
This page contains information about D-efficiency and GWLP values of the arrays. The results have been generated with the Orthogonal Array package. If you use these data, please cite the paper Complete Enumeration of Pure-Level and Mixed-Level Orthogonal Arrays.
Results
| Statistic | Results |
| Number of non-isomorphic arrays | 54 |
| Best GWLP | 1.0000,0.0000,0.0000,0.0000,0.0000 1 array |
| D-efficiency | Best value: 1.0000 [1 array with highest D-efficiency value] |
| Average VIF | Best value 1.0000 [1 array with best average VIF value] |
| E-efficiency | Best value 1.0000 |
| Data | all arrays |
| Data (54 best VIF arrays) | 54 array(s) |
| Processing time | < 1 minute |
Scatter plot
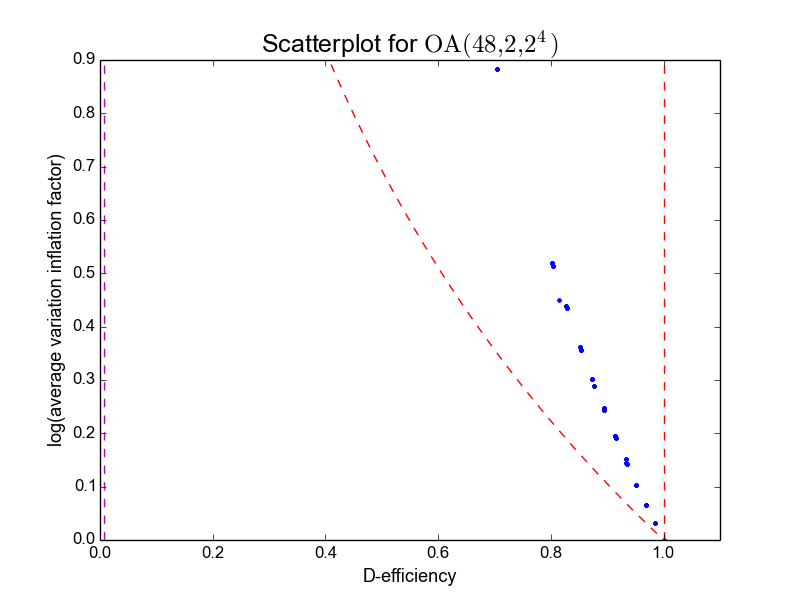
Table of arrays (selection)
| Array | Rank (2nd order) | D-efficiency | Average VIF | E-efficiency | GWLP |
|---|---|---|---|---|---|
| 3 | 11 | 1.00000 | 1.00000 | 1.00000 | 1.00,0.00,0.00,0.00,0.00 |
| 15 | 11 | 0.98453 | 1.03209 | 0.76430 | 1.00,0.00,0.00,0.02778,0.02778 |
| 14 | 11 | 0.98453 | 1.03209 | 0.76430 | 1.00,0.00,0.00,0.05556,0.00 |
| 2 | 11 | 0.96839 | 1.06818 | 0.66667 | 1.00,0.00,0.00,0.00,0.1111 |
| 33 | 11 | 0.96839 | 1.06818 | 0.66667 | 1.00,0.00,0.00,0.1111,0.00 |
| 9 | 11 | 0.96835 | 1.06845 | 0.59175 | 1.00,0.00,0.00,0.1111,0.00 |
| 10 | 11 | 0.96835 | 1.06845 | 0.59175 | 1.00,0.00,0.00,0.08333,0.02778 |
| 31 | 11 | 0.95145 | 1.10940 | 0.54466 | 1.00,0.00,0.00,0.1389,0.02778 |
| 30 | 11 | 0.95145 | 1.10940 | 0.54466 | 1.00,0.00,0.00,0.1667,0.00 |
| 12 | 11 | 0.95145 | 1.10940 | 0.54466 | 1.00,0.00,0.00,0.05556,0.1111 |
| Index | D-efficiency | Mean 3-proj D-eff |
|---|---|---|
| 3 | 1.0000 | 1.0000 |
| 15 | 0.9845 | 0.9970 |
| 14 | 0.9845 | 0.9940 |
| 2 | 0.9684 | 1.0000 |
| 33 | 0.9684 | 0.9877 |
| 9 | 0.9683 | 0.9880 |
| 10 | 0.9683 | 0.9910 |
| 31 | 0.9514 | 0.9847 |
| 30 | 0.9514 | 0.9817 |
| 12 | 0.9514 | 0.9940 |
Page generated on Fri Mar 11 00:19:51 2016.