Class OA(52; 2; 24)
This page contains information about D-efficiency and GWLP values of the arrays. The results have been generated with the Orthogonal Array package. If you use these data, please cite the paper Complete Enumeration of Pure-Level and Mixed-Level Orthogonal Arrays.
Results
| Statistic | Results |
| Number of non-isomorphic arrays | 48 |
| Best GWLP | 1.0000,0.0000,0.0000,0.0237,0.0059 1 array |
| D-efficiency | Best value: 0.9918 [1 array with highest D-efficiency value] |
| Average VIF | Best value 1.0167 [1 array with best average VIF value] |
| E-efficiency | Best value 0.7692 |
| Data | all arrays |
| Data (48 best VIF arrays) | 48 array(s) |
| Processing time | < 1 minute |
Scatter plot
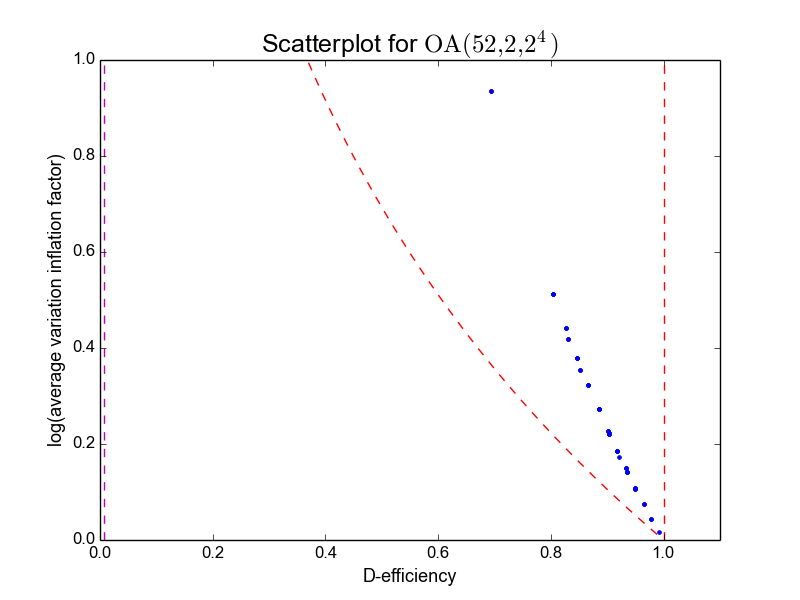
Table of arrays (selection)
| Array | Rank (2nd order) | D-efficiency | Average VIF | E-efficiency | GWLP |
|---|---|---|---|---|---|
| 5 | 11 | 0.99184 | 1.01667 | 0.76923 | 1.00,0.00,0.00,0.02367,0.005917 |
| 3 | 11 | 0.97842 | 1.04538 | 0.72603 | 1.00,0.00,0.00,0.02367,0.05325 |
| 19 | 11 | 0.97842 | 1.04538 | 0.72603 | 1.00,0.00,0.00,0.07101,0.005917 |
| 18 | 11 | 0.96436 | 1.07798 | 0.57121 | 1.00,0.00,0.00,0.1183,0.005917 |
| 20 | 11 | 0.96436 | 1.07798 | 0.57121 | 1.00,0.00,0.00,0.07101,0.05325 |
| 12 | 11 | 0.95004 | 1.11260 | 0.53846 | 1.00,0.00,0.00,0.1657,0.005917 |
| 14 | 11 | 0.95004 | 1.11260 | 0.53846 | 1.00,0.00,0.00,0.1183,0.05325 |
| 35 | 11 | 0.94990 | 1.11336 | 0.53846 | 1.00,0.00,0.00,0.1657,0.005917 |
| 4 | 11 | 0.94990 | 1.11336 | 0.53846 | 1.00,0.00,0.00,0.02367,0.1479 |
| 33 | 11 | 0.93487 | 1.15270 | 0.51497 | 1.00,0.00,0.00,0.1657,0.05325 |
| Index | D-efficiency | Mean 3-proj D-eff |
|---|---|---|
| 5 | 0.9918 | 0.9975 |
| 3 | 0.9784 | 0.9975 |
| 19 | 0.9784 | 0.9923 |
| 18 | 0.9644 | 0.9871 |
| 20 | 0.9644 | 0.9923 |
| 12 | 0.9500 | 0.9820 |
| 14 | 0.9500 | 0.9871 |
| 35 | 0.9499 | 0.9815 |
| 4 | 0.9499 | 0.9975 |
| 33 | 0.9349 | 0.9815 |
Page generated on Fri Mar 11 00:19:51 2016.