Class OA(56; 2; 24)
This page contains information about D-efficiency and GWLP values of the arrays. The results have been generated with the Orthogonal Array package. If you use these data, please cite the paper Complete Enumeration of Pure-Level and Mixed-Level Orthogonal Arrays.
Results
| Statistic | Results |
| Number of non-isomorphic arrays | 84 |
| Best GWLP | 1.0000,0.0000,0.0000,0.0000,0.0204 1 array |
| D-efficiency | Best value: 0.9944 [2 arrays with highest D-efficiency value] |
| Average VIF | Best value 1.0114 [2 arrays with best average VIF value] |
| E-efficiency | Best value 0.8571 |
| Data | all arrays |
| Data (80 best VIF arrays) | 80 array(s) |
| Processing time | < 1 minute |
Scatter plot
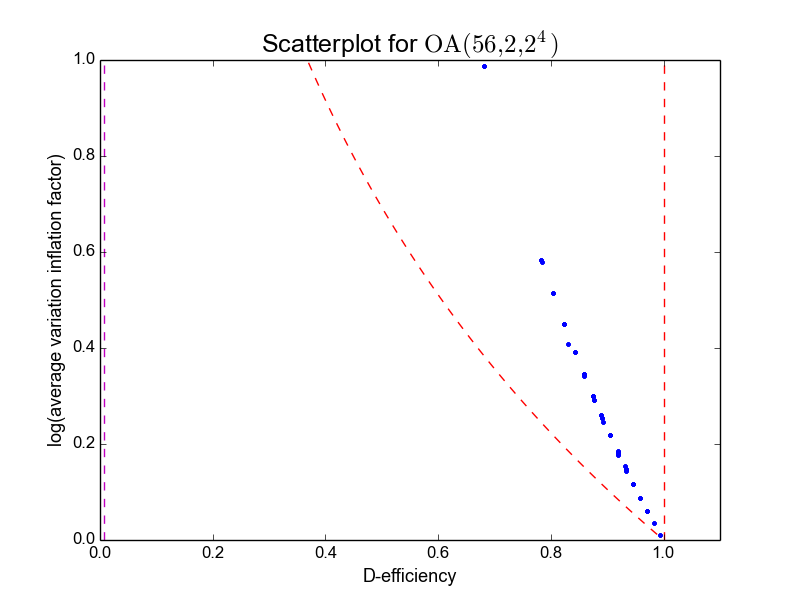
Table of arrays (selection)
| Array | Rank (2nd order) | D-efficiency | Average VIF | E-efficiency | GWLP |
|---|---|---|---|---|---|
| 18 | 11 | 0.99439 | 1.01136 | 0.85714 | 1.00,0.00,0.00,0.02041,0.00 |
| 3 | 11 | 0.99439 | 1.01136 | 0.85714 | 1.00,0.00,0.00,0.00,0.02041 |
| 15 | 11 | 0.98291 | 1.03560 | 0.71429 | 1.00,0.00,0.00,0.06122,0.00 |
| 16 | 11 | 0.98291 | 1.03560 | 0.71429 | 1.00,0.00,0.00,0.04082,0.02041 |
| 9 | 11 | 0.97119 | 1.06136 | 0.71429 | 1.00,0.00,0.00,0.08163,0.02041 |
| 41 | 11 | 0.97107 | 1.06198 | 0.68056 | 1.00,0.00,0.00,0.102,0.00 |
| 17 | 11 | 0.97107 | 1.06198 | 0.68056 | 1.00,0.00,0.00,0.02041,0.08163 |
| 42 | 11 | 0.97107 | 1.06198 | 0.68056 | 1.00,0.00,0.00,0.08163,0.02041 |
| 14 | 11 | 0.97088 | 1.06313 | 0.57143 | 1.00,0.00,0.00,0.08163,0.02041 |
| 10 | 11 | 0.95878 | 1.09129 | 0.55343 | 1.00,0.00,0.00,0.06122,0.08163 |
| Index | D-efficiency | Mean 3-proj D-eff |
|---|---|---|
| 18 | 0.9944 | 0.9978 |
| 3 | 0.9944 | 1.0000 |
| 15 | 0.9829 | 0.9934 |
| 16 | 0.9829 | 0.9956 |
| 9 | 0.9712 | 0.9912 |
| 41 | 0.9711 | 0.9888 |
| 17 | 0.9711 | 0.9978 |
| 42 | 0.9711 | 0.9910 |
| 14 | 0.9709 | 0.9912 |
| 10 | 0.9588 | 0.9934 |
Page generated on Fri Mar 11 00:19:51 2016.