Class OA(60; 2; 24)
This page contains information about D-efficiency and GWLP values of the arrays. The results have been generated with the Orthogonal Array package. If you use these data, please cite the paper Complete Enumeration of Pure-Level and Mixed-Level Orthogonal Arrays.
Results
| Statistic | Results |
| Number of non-isomorphic arrays | 79 |
| Best GWLP | 1.0000,0.0000,0.0000,0.0178,0.0044 1 array |
| D-efficiency | Best value: 0.9939 [1 array with highest D-efficiency value] |
| Average VIF | Best value 1.0124 [1 array with best average VIF value] |
| E-efficiency | Best value 0.8667 |
| Data | all arrays |
| Data (79 best VIF arrays) | 79 array(s) |
| Processing time | < 1 minute |
Scatter plot
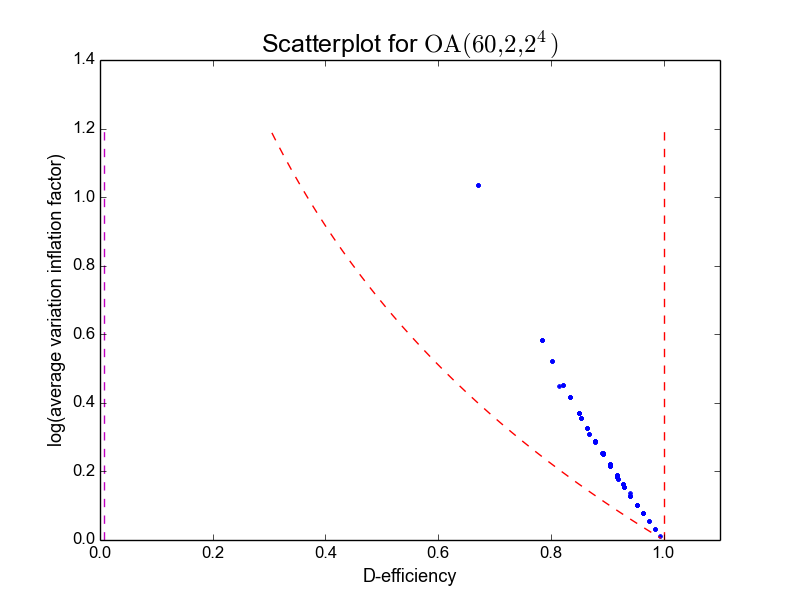
Table of arrays (selection)
| Array | Rank (2nd order) | D-efficiency | Average VIF | E-efficiency | GWLP |
|---|---|---|---|---|---|
| 5 | 11 | 0.99389 | 1.01238 | 0.86667 | 1.00,0.00,0.00,0.01778,0.004444 |
| 6 | 11 | 0.98389 | 1.03351 | 0.70851 | 1.00,0.00,0.00,0.01778,0.04 |
| 25 | 11 | 0.98389 | 1.03351 | 0.70851 | 1.00,0.00,0.00,0.05333,0.004444 |
| 23 | 11 | 0.97365 | 1.05605 | 0.68187 | 1.00,0.00,0.00,0.05333,0.04 |
| 21 | 11 | 0.97365 | 1.05605 | 0.68187 | 1.00,0.00,0.00,0.08889,0.004444 |
| 3 | 11 | 0.96308 | 1.08064 | 0.64185 | 1.00,0.00,0.00,0.01778,0.1111 |
| 49 | 11 | 0.96308 | 1.08064 | 0.64185 | 1.00,0.00,0.00,0.1244,0.004444 |
| 22 | 11 | 0.96292 | 1.08164 | 0.55106 | 1.00,0.00,0.00,0.08889,0.04 |
| 20 | 11 | 0.96292 | 1.08164 | 0.55106 | 1.00,0.00,0.00,0.1244,0.004444 |
| 12 | 11 | 0.95235 | 1.10653 | 0.54230 | 1.00,0.00,0.00,0.16,0.004444 |
| Index | D-efficiency | Mean 3-proj D-eff |
|---|---|---|
| 5 | 0.9939 | 0.9981 |
| 6 | 0.9839 | 0.9981 |
| 25 | 0.9839 | 0.9942 |
| 23 | 0.9737 | 0.9942 |
| 21 | 0.9737 | 0.9904 |
| 3 | 0.9631 | 0.9981 |
| 49 | 0.9631 | 0.9863 |
| 22 | 0.9629 | 0.9904 |
| 20 | 0.9629 | 0.9865 |
| 12 | 0.9523 | 0.9827 |
Page generated on Fri Mar 11 00:19:51 2016.