Class OA(72; 3; 26)
This page contains information about D-efficiency and GWLP values of the arrays. The results have been generated with the Orthogonal Array package. If you use these data, please cite the paper Complete Enumeration of Pure-Level and Mixed-Level Orthogonal Arrays.
Results
| Statistic | Results |
| Number of non-isomorphic arrays | 906 |
| Best GWLP | 1.0000,0.0000,0.0000,0.0000,0.1852,0.0000,0.0000 1 array |
| D-efficiency | Best value: 0.9745 [2 arrays with highest D-efficiency value] |
| Average VIF | Best value 1.0542 [1 array with best average VIF value] |
| E-efficiency | Best value 0.6667 |
| Data | all arrays (binary) |
| Data (80 best VIF arrays) | 80 array(s) |
| Processing time | < 1 minute |
Scatter plot
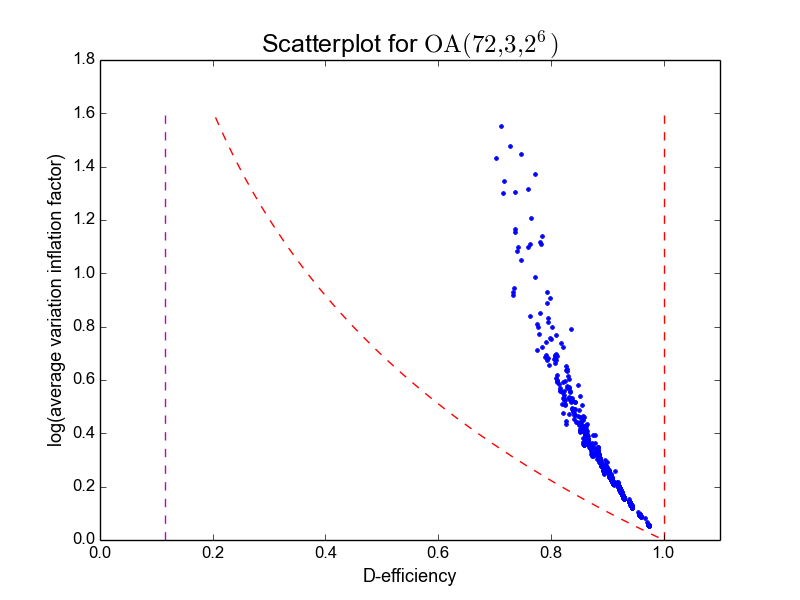
Table of arrays (selection)
| Array | Rank (2nd order) | D-efficiency | Average VIF | E-efficiency | GWLP |
|---|---|---|---|---|---|
| 0 | 22 | 0.97450 | 1.05455 | 0.66667 | 1.00,0.00,0.00,0.00,0.1852,0.2963,0.1975 |
| 1 | 22 | 0.97450 | 1.05455 | 0.66667 | 1.00,0.00,0.00,0.00,0.1852,0.2963,0.00 |
| 16 | 22 | 0.97435 | 1.05424 | 0.66667 | 1.00,0.00,0.00,0.00,0.1852,0.2963,0.04938 |
| 2 | 22 | 0.97399 | 1.05634 | 0.54070 | 1.00,0.00,0.00,0.00,0.1852,0.1975,0.04938 |
| 4 | 22 | 0.97399 | 1.05634 | 0.54070 | 1.00,0.00,0.00,0.00,0.1852,0.1975,0.04938 |
| 19 | 22 | 0.97399 | 1.05624 | 0.52933 | 1.00,0.00,0.00,0.00,0.1852,0.09877,0.1975 |
| 7 | 22 | 0.97399 | 1.05624 | 0.52933 | 1.00,0.00,0.00,0.00,0.1852,0.09877,0.00 |
| 9 | 22 | 0.97399 | 1.05624 | 0.52933 | 1.00,0.00,0.00,0.00,0.1852,0.2963,0.00 |
| 11 | 22 | 0.97399 | 1.05624 | 0.52933 | 1.00,0.00,0.00,0.00,0.1852,0.09877,0.1975 |
| 32 | 22 | 0.97399 | 1.05624 | 0.52933 | 1.00,0.00,0.00,0.00,0.1852,0.4938,0.00 |
| Index | D-efficiency | Mean 3-proj D-eff | Mean 4-proj D-eff | Mean 5-proj D-eff |
|---|---|---|---|---|
| 0 | 0.9745 | 1.0000 | 0.9966 | 0.9881 |
| 1 | 0.9745 | 1.0000 | 0.9966 | 0.9881 |
| 16 | 0.9743 | 1.0000 | 0.9966 | 0.9881 |
| 2 | 0.9740 | 1.0000 | 0.9966 | 0.9881 |
| 4 | 0.9740 | 1.0000 | 0.9966 | 0.9881 |
| 19 | 0.9740 | 1.0000 | 0.9966 | 0.9881 |
| 7 | 0.9740 | 1.0000 | 0.9966 | 0.9881 |
| 9 | 0.9740 | 1.0000 | 0.9966 | 0.9881 |
| 11 | 0.9740 | 1.0000 | 0.9966 | 0.9881 |
| 32 | 0.9740 | 1.0000 | 0.9966 | 0.9881 |
Page generated on Fri Mar 11 00:10:56 2016.