Class OA(80; 3; 26)
This page contains information about D-efficiency and GWLP values of the arrays. The results have been generated with the Orthogonal Array package. If you use these data, please cite the paper Complete Enumeration of Pure-Level and Mixed-Level Orthogonal Arrays.
Results
| Statistic | Results |
| Number of non-isomorphic arrays | 3494 |
| Best GWLP | 1.0000,0.0000,0.0000,0.0000,0.0000,0.2400,0.0400 1 array |
| D-efficiency | Best value: 1.0000 [1 array with highest D-efficiency value] |
| Average VIF | Best value 1.0000 [1 array with best average VIF value] |
| E-efficiency | Best value 1.0000 |
| Data | all arrays (binary) |
| Data (80 best VIF arrays) | 80 array(s) |
| Processing time | < 1 minute |
Scatter plot
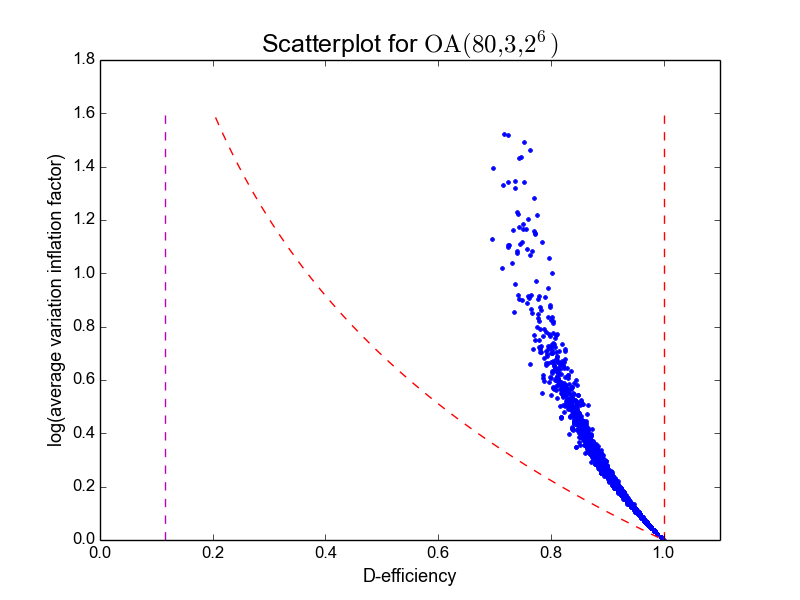
Table of arrays (selection)
| Array | Rank (2nd order) | D-efficiency | Average VIF | E-efficiency | GWLP |
|---|---|---|---|---|---|
| 0 | 22 | 1.00000 | 1.00000 | 1.00000 | 1.00,0.00,0.00,0.00,0.00,0.24,0.04 |
| 6 | 22 | 0.99445 | 1.01136 | 0.80000 | 1.00,0.00,0.00,0.00,0.04,0.32,0.00 |
| 18 | 22 | 0.99445 | 1.01136 | 0.80000 | 1.00,0.00,0.00,0.00,0.04,0.16,0.00 |
| 14 | 22 | 0.99445 | 1.01136 | 0.80000 | 1.00,0.00,0.00,0.00,0.04,0.16,0.16 |
| 11 | 22 | 0.99445 | 1.01136 | 0.80000 | 1.00,0.00,0.00,0.00,0.04,0.48,0.00 |
| 2 | 22 | 0.98885 | 1.02306 | 0.71716 | 1.00,0.00,0.00,0.00,0.08,0.40,0.04 |
| 13 | 22 | 0.98885 | 1.02306 | 0.71716 | 1.00,0.00,0.00,0.00,0.08,0.08,0.36 |
| 16 | 22 | 0.98885 | 1.02306 | 0.71716 | 1.00,0.00,0.00,0.00,0.08,0.08,0.04 |
| 10 | 22 | 0.98885 | 1.02306 | 0.71716 | 1.00,0.00,0.00,0.00,0.08,0.40,0.04 |
| 5 | 22 | 0.98885 | 1.02306 | 0.71716 | 1.00,0.00,0.00,0.00,0.08,0.24,0.04 |
| Index | D-efficiency | Mean 3-proj D-eff | Mean 4-proj D-eff | Mean 5-proj D-eff |
|---|---|---|---|---|
| 0 | 1.0000 | 1.0000 | 1.0000 | 1.0000 |
| 6 | 0.9944 | 1.0000 | 0.9993 | 0.9975 |
| 18 | 0.9944 | 1.0000 | 0.9993 | 0.9975 |
| 14 | 0.9944 | 1.0000 | 0.9993 | 0.9975 |
| 11 | 0.9944 | 1.0000 | 0.9993 | 0.9975 |
| 2 | 0.9889 | 1.0000 | 0.9985 | 0.9949 |
| 13 | 0.9889 | 1.0000 | 0.9985 | 0.9949 |
| 16 | 0.9889 | 1.0000 | 0.9985 | 0.9949 |
| 10 | 0.9889 | 1.0000 | 0.9985 | 0.9949 |
| 5 | 0.9889 | 1.0000 | 0.9985 | 0.9949 |
Page generated on Fri Mar 11 00:10:56 2016.